Editorial &
Data Storytelling
Editing, Copywriting & Design for a 34-Page B2B White Paper · Oxyzn Internship
Editing, Copywriting & Design for a 34-Page B2B White Paper · Oxyzn Internship
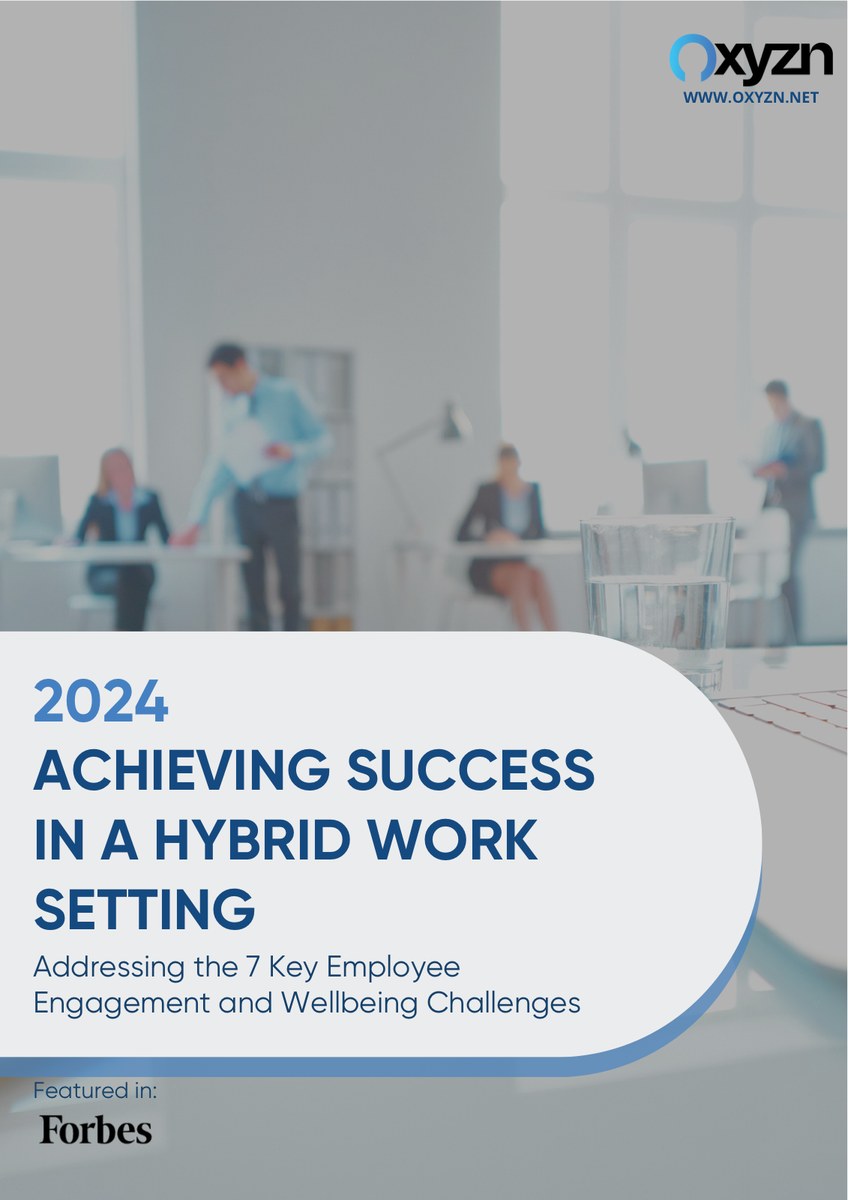
Oxyzn is an employee engagement and wellbeing platform. It had commissioned research and interviews on hybrid working and wanted a white paper out of it: a document senior HR and People leaders would actually read, and that would earn a strategy call at the end of it.
I was the editor and designer. The underlying research and the founder's point of view came from the company. My job was everything between that and a finished 34-page document: the structure, the copy, how the statistics were framed and sequenced, and the layout of every page.
This work was completed during a marketing analyst internship at Oxyzn between March and June 2024. The published white paper is credited to me as Editor and Designer; the underlying research and the founder's commentary are the company's.
A pile of findings became seven named challenges, in a deliberate order.
The research covered a lot of ground: digital fatigue, isolation, blurred boundaries, mental health, leadership, performance measurement, inclusion. Presented flat, it reads as a list of complaints. The editorial decision was to name seven challenges and sequence them so the paper moves outward from the individual to the organisation: it opens with what a person feels at their desk and ends with equity and policy.
That order is the argument. By the time a reader reaches inclusivity and equity, they have already accepted the six problems underneath it, so the hardest chapter lands on prepared ground rather than cold.
Statistics were selected and framed for what they prove, not for how impressive they look.
A white paper aimed at HR directors lives or dies on whether its evidence feels honest. Every figure had to be attributable, relevant to the specific claim next to it, and placed where the reader would already be asking the question it answered. Numbers that were merely striking got cut.
The paper also carries the company's own interview findings alongside published research. Keeping those two clearly distinguishable, so a reader can tell primary research from cited market data, mattered more to credibility than any individual statistic did.
Inclusivity and equity, where the data is about real people and gets read closely.
| Group | Finding |
|---|---|
| Employees with disabilities | 11% more likely to prefer hybrid work |
| Non-binary employees | 14% more likely to prefer hybrid work |
| LGBTQ+ employees | 13% more likely to prefer hybrid work |
| LGBTQ+ employees | 24% more likely to leave than heterosexual colleagues |
| Employees with disabilities | 14% more likely to leave than colleagues without |
This section carried the highest risk of being read as tokenism. The editorial choice was to let the figures sit plainly, one per line, with no adjectives around them and no illustration competing for attention. Where a statistic described a group of people, the copy stated the finding and stopped.
Restraint was the right call commercially as well as ethically. The audience for this paper includes people who have read a lot of superficial diversity content, and the fastest way to lose them is to decorate a number about their own working conditions.
One system, applied consistently, so the document reads as a single voice.
Section dividers, a two-column body grid, pull-out statistic callouts, a running footer and a consistent type hierarchy carry the reader from the cover through to the closing call to action. Long research text was broken with data callouts at the points where attention typically drops, roughly every page and a half.
The document ends where a lead magnet has to end: a specific offer, a named contact and a QR code, sitting inside the same design system as everything before it rather than bolted on as an advert.
Editing is where marketing and analysis actually meet.
This was the project that made the connection between the two halves of my work concrete. Choosing which statistic to put on a page, and what to claim beside it, is an analytical decision and a marketing decision at the same time. Get it wrong in one direction and the paper is dry. Get it wrong in the other and it overclaims, and an HR director notices immediately.
It is the same judgement I use on a dashboard: the number is the easy part, and deciding what it entitles you to say is the work.