SQL Analysis
& Reporting
Querying the Voice of Customer Repository · intellimation.ai
Querying the Voice of Customer Repository · intellimation.ai
My Enterprise AI Product Marketing case study covers how I built intellimation.ai's Voice of Customer repository from zero: capturing and categorising customer questions from every demo, POC and client meeting into a shared source of truth. This case study picks up from there, treating that repository as a dataset and querying it directly in SQL to surface patterns no single conversation could show on its own.
Building the repository and analysing it were two different disciplines, done by the same person for the same programme. Every number, table and chart below comes directly from the underlying question log. Nothing here is modelled, projected, or rounded up for effect.
One flat question log, captured at the point of every demo, POC and client meeting. No pre-aggregation, no cleaning applied at source. That part came later, in SQL.
question_id       text        -- e.g. Q-001
log_date          date        -- meeting date
company_type_raw  text        -- captured free-text at intake (messy)
region            text        -- client HQ / desk region
pillar            text        -- product line, tagged inconsistently
sales_stage       text        -- free-text sales stage at time of capture
question_type     text        -- Functional / Technical / Strategic / Commercial / Compliance
question_text     text
answer_text       text
Company type and region were captured reliably: tagged on 98% and 86% of rows. Pillar, sales stage and question category were not, which is where the analysis had to start.
Before asking what the data said, I had to know how much of it could be trusted. The honest answer, for three of six fields, was: not much yet.
SELECT
  COUNT(*)                                            AS total_questions,
  COUNT(pillar)                                       AS pillar_tagged,
  COUNT(sales_stage)                                  AS stage_tagged,
  COUNT(question_type)                                AS category_tagged,
  ROUND(COUNT(pillar)       * 100.0 / COUNT(*), 1)    AS pct_pillar,
  ROUND(COUNT(sales_stage)  * 100.0 / COUNT(*), 1)    AS pct_stage,
  ROUND(COUNT(question_type)* 100.0 / COUNT(*), 1)    AS pct_category
FROM voc_questions;
| total_questions | pillar_tagged | stage_tagged | category_tagged | pct_pillar | pct_stage | pct_category |
|---|---|---|---|---|---|---|
| 749 | 161 | 164 | 228 | 21.5% | 21.9% | 30.4% |
Company type was captured as free text, so the same segment showed up under slightly different labels. A CASE statement standardised it before anything else could be trusted.
SELECT
  CASE
    WHEN company_type_raw IN ('Tier 2 Regional Bank', 'Tier 2 / Regional Bank')
      THEN 'Tier 2 / Regional Bank'
    WHEN company_type_raw IN ('Vendor / Consulting', 'Consulting / Vendor')
      THEN 'Consulting / Vendor'
    WHEN company_type_raw = 'Asset Management'
      THEN 'Asset Manager / Investment'
    ELSE COALESCE(company_type_raw, '(untagged)')
  END                       AS company_type,
  COUNT(*)                  AS questions
FROM voc_questions
GROUP BY 1
ORDER BY questions DESC;
| company_type | questions |
|---|---|
| Tier 1 Bank | 260 |
| Asset Manager / Investment | 223 |
| Hedge Fund / Alternative | 105 |
| Vendor / Fintech | 34 |
| All other segments (9 categories) | 127 |
749 total. Tier 1 Banks and Asset Managers together account for nearly two-thirds of every question logged.
Grouping the tagged subset by product pillar and by region, the two dimensions the business cared about most.
SELECT
  pillar,
  COUNT(*)                                              AS questions,
  ROUND(COUNT(*) * 100.0 / SUM(COUNT(*)) OVER (), 1)    AS pct_of_tagged
FROM voc_questions
WHERE pillar IS NOT NULL
GROUP BY pillar
ORDER BY questions DESC;
SELECT
  region,
  COUNT(*)                                    AS questions,
  RANK() OVER (ORDER BY COUNT(*) DESC)        AS rank
FROM voc_questions
WHERE region IS NOT NULL
GROUP BY region
ORDER BY rank;
Joining the cleaned company-type view back to pillar tags surfaced a pattern clear enough to write straight into messaging.
SELECT
  c.company_type,
  SUM(CASE WHEN q.pillar = 'Collateral Management' THEN 1 ELSE 0 END) AS collateral_mgmt,
  SUM(CASE WHEN q.pillar = 'Structured Products'   THEN 1 ELSE 0 END) AS structured_products,
  SUM(CASE WHEN q.pillar = 'Direct Lending'         THEN 1 ELSE 0 END) AS direct_lending,
  SUM(CASE WHEN q.pillar IS NULL                    THEN 1 ELSE 0 END) AS untagged
FROM voc_questions q
JOIN dim_company_type_clean c ON c.raw_value = q.company_type_raw
WHERE c.company_type IN ('Tier 1 Bank','Asset Manager / Investment','Hedge Fund / Alternative')
GROUP BY c.company_type
ORDER BY untagged DESC;
| company_type | collateral_mgmt | structured_products | direct_lending | untagged |
|---|---|---|---|---|
| Tier 1 Bank | 33 | 25 | 4 | 198 |
| Asset Manager / Investment | 35 | 0 | 0 | 188 |
| Hedge Fund / Alternative | 3 | 44 | 0 | 58 |
Sales stage was free text at capture: "1st", "Presentation", "Needs analysis" and a handful of values that were clearly meant for a different column entirely. A small lookup table cleaned it up.
-- dim_stage_bucket(raw_stage, funnel_stage) maps messy free-text
-- stage values onto four clean funnel buckets
SELECT
  COALESCE(b.funnel_stage, 'Untagged') AS funnel_stage,
  COUNT(*)                             AS questions
FROM voc_questions q
LEFT JOIN dim_stage_bucket b
  ON q.sales_stage = b.raw_stage
GROUP BY 1
ORDER BY questions DESC;
| funnel_stage | questions |
|---|---|
| Untagged | 585 |
| Presentation | 67 |
| Discovery | 47 |
| Qualification | 44 |
| Miscategorised (technical/functional labels found in this field) | 4 |
| Closed | 2 |
The 4 "miscategorised" rows had question-category values ("Technical (deployment/integration)", "Functional (features/workflows)") entered into the sales-stage field, a genuine intake error worth flagging back to the capture process, not something to quietly merge away.
A running total by quarter, using a window function over the 733 rows with a usable log date.
SELECT
  quarter,
  questions,
  SUM(questions) OVER (ORDER BY quarter) AS cumulative_questions
FROM (
  SELECT
    CONCAT(EXTRACT(YEAR FROM log_date), '-Q', EXTRACT(QUARTER FROM log_date)) AS quarter,
    COUNT(*) AS questions
  FROM voc_questions
  WHERE log_date IS NOT NULL
  GROUP BY 1
) quarterly
ORDER BY quarter;
| quarter | questions | cumulative_questions |
|---|---|---|
| 2024-Q2 | 126 | 126 |
| 2024-Q3 | 219 | 345 |
| 2024-Q4 | 53 | 398 |
| 2025-Q1 | 35 | 433 |
| 2025-Q2 | 176 | 609 |
| 2025-Q3 | 124 | 733 |
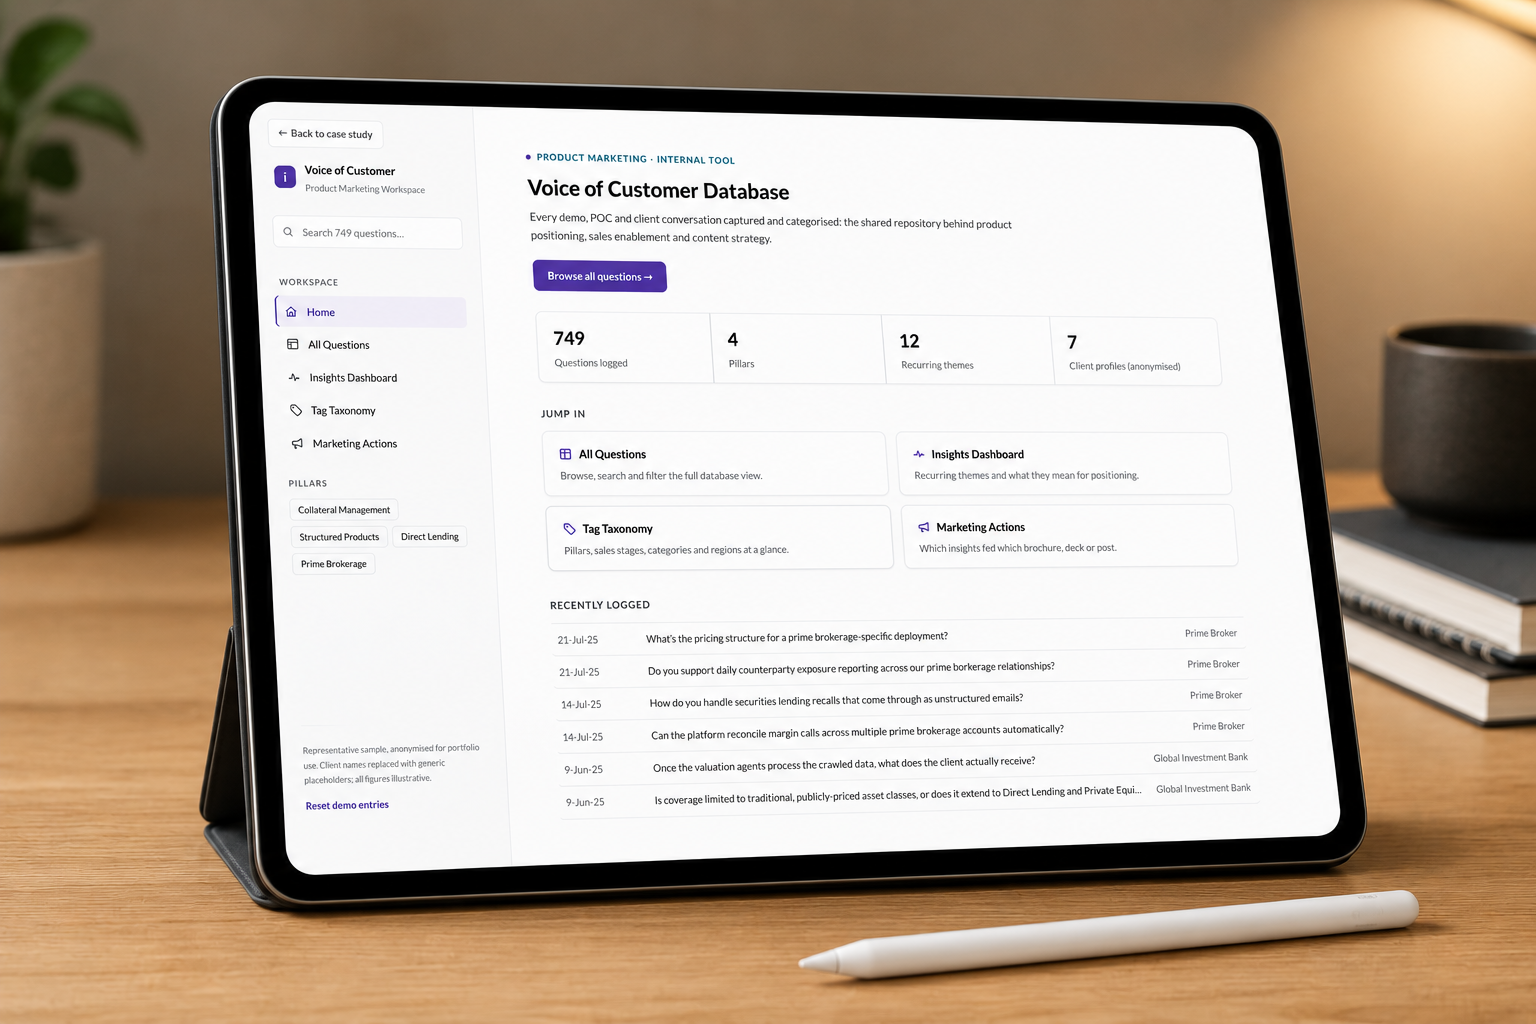
The version of this that actually got looked at week to week: KPI tiles up top, the two distributions that mattered underneath.
Not a separate deliverable: the evidence layer underneath the product marketing programme.
This SQL work fed directly into the programme described in the Enterprise AI Product Marketing case study. Flagging how much pillar, stage and category metadata was missing led to a simpler tagging process at the point of capture going forward. Confirming which client segments asked about which pillar gave the messaging work an evidence base instead of a hunch. And tracking the repository's growth quarter over quarter kept the underlying dataset honest, including catching when a single detailed session, not a real shift in demand, explained a spike.
Two disciplines, one repository: building it, and analysing it.